Not everything that can be counted counts, and not everything that counts can be counted, thus spake Albert Einstein. But counting matters as the Stiglitz-Fitoussi-Sen report pointed out, “What we measure affects what we do and if our measurements are flawed, decisions may be distorted........if metrics of performance are flawed, so too may be inferences we draw.”
There is a new buzz in town with the United Nations Secretary General (UNSG) calling for data revolution for sustainable development. Much has been written about the novelty of this approach i.e. harnessing technology and the private sector to produce more actionable data, monitor and track development.
There has also been much angst about the diluted definition of data i.e. where it has been restricted to numbers and the naive assumption that technology and private sector will provide the silver bullet solution to data-deficit.
Absence of accountability as the bedrock of public data for public action is also another cause for angst amongst data-geeks. Not to forget the non-recognition of people, politics and power, i.e. if a state was non-responsive to its citizens before, would it be more responsive, only because of robust data-sets?
Data revolution in the era of increasing censorship, where disclosure policies and sunshine laws are being rescinded, is another worry; so is the watering down of whistle-blowers’ protection legislations, India being a case in point. Additional concerns have been the inadequate attention to the bottom billion who are still impacted by the digital divide.
But to give credit where it is due, thanks to data revolution, the seemingly esoteric topics of statistical commissions, their capacities, surveys, survey findings and usage, and financing of independent, robust surveys are getting global traction. However, in all this excitement, the onslaught of censorship or quasi-censorship on inconvenient surveys also deserves attention.
From arts and comedy to survey findings: An open season for censorship
Enough outrage has flowed on main-street and the virtual world on the censorship of films, comedians’ acts and literature. India has acquired the ignominy of being one of the countries at the fore-front of proscribing books. But in this din over freedom of speech and expression, not much has been written about the constant censoring of inconvenient survey findings.
Some recent trends in this regard:
The 3rd National Family Health Survey (NFHS) in 2004-5 showed that the malnutrition percentages in India have gone up. This was in the midst of the Shining India narrative when India’s national Gross Domestic Product was growing at almost double-digits.
The increased malnutrition numbers gave a body blow to the pro-liberalisation, orthodox economists’ theory of growth being good and possessing a trickle-down effect. The result was predictable; some states like Madhya Pradesh challenged the methodology and wanted to conduct their own in-house surveys to show better performance.

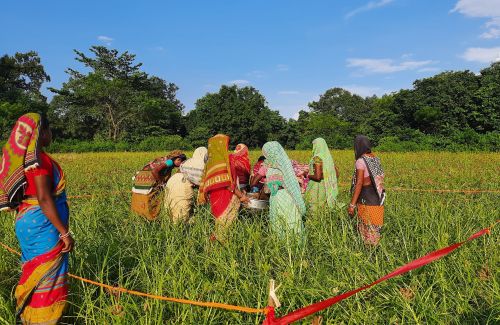
The 3rd NFHS (2004-05) showed that the malnutrition % in states liks Madhya Pradesh have gone up. Picture showing a worker measuring to find if a child is underweight or not, Thar district, MP. Pic: Wikimedia Commons
It is pertinent to note that NFHS is one of the most credible health surveys conducted in the world with globally bench-marked methodology. But the NFHS exercise was halted by governmental action, for 10 long years. It was after much advocacy by public health activists, nutritionists, public intellectuals and heterodox economists that the exercise was revived and the 4th round of the Survey is expected to be in the open in 2015-2016.
In 2011, the World Bank came out with its seminal work, Poverty and Social Exclusion in India. It used multiple data decomposition and regression analyses to see how four socially marginalised groups were doing economically, through the prism of the discrimination they face, and to identify affirmative action policies that worked and offered scope for replication and scale up.
The four groups were, Dalits, Adivasis, Women and Muslims. But the Government of India allowed three identity groups’ findings to be published, barring the Muslims’ chapter. And the Bank report stated that in its executive summary too. Interesting to note, there was hardly any protest from minority rights activists or free-speech advocates about this gagging of the Muslim chapter.
In 2013-2014, Unicef conducted the Rapid Survey of Children, RSOC, for the Government of India. It seems there is impressive improvement too on the front. Yet the survey is yet to see the light of day.
One of the reasons cited in the inner circles is that while the pan India averages are good, Gujarat has shown considerable decline, which gives a body blow to the Gujarat development model narrative. Hence, the gag.
There is still hope that the survey will be made public, after the government and the concerned departments are assured of the methodological rigour. But going by the practise and trend, it will not be surprising if the survey is actually published, when the data has become irrelevant and the public discourse on children and malnutrition has shifted.
These are big stories, and need as much public attention and media scrutiny as any film ban or cancellation of comedy performance. That these are public surveys meant for public programming makes the silence around their censoring, even more worrisome. This reminds one of the denial that the government went into, in default mode, when the National Crimes Record Bureau data-sets were used by Professor Nagaraj to unravel the farmers’ suicide story. That journalists took note and wrote about it extensively, forcing public action, still gives hope that, the censorship of these surveys, will also catch media and public attention.
Harnessing data revolution 1.0 first
The public discourse around data deficit and data dishonesty and need for greater and better investments in data-generation has been at a peak, from health, economics and development practitioners as well as policy wonks. But what happens when some of the most robust data-sets are either not asking the key questions around disaggregation or not releasing unit-level data in time when they are relevant for effective planning?

The poverty measurement exercise is also marred by arcane language and methodology challenges. The year 2014 saw the Rangarajan Committee report, Planning Commission and Asian Development Bank giving three different sets of numbers of the poor for India.
It is thus important to make the surveys, their methods, metrics, questions and language accessible to the public. Only then would public engagement and public action be possible on the survey findings.
Reclaiming statistics as a public good
The UNSG’s call has its own flaws. Other than the concerns listed above, the UNSG-appointed International Expert Advisory Group submitted its recommendations on 24 October 2014 and opened the feedback/comments window only till 26 October 2014; this smacked of non-inclusion and arrogance. That they expected the world to be glued to their computers and give comments over a weekend, did not even make the pretence that the exercise cared for public participation or comments.
What was even more worrisome was the fact that this action de-coupled data from accountability by almost closing the comments/feedback window of opportunity. Savio Carvalho of Amnesty International and Neva Frecheville of CAFOD have done an insightful critique of the process in their piece, How not to run a consultation.
But once again, credit, where it is due: with the international focus on data, data journalism is on the rise. From the Guardian, Pro Publica to our own India Spend and Factly India the genre has seen commendable initiatives. And as the Factly tagline says, “making public data meaningful” is the need of the hour.
Equally important is to reclaim statistics as a public good, to democratise it. Survey questions and findings need to speak to the living and lived realities of the poor and the hungry, rather than be mere theoretical exercises with weights and deflators. While the UN Food and Agriculture Organisation, FAO, changed its hunger definition, making it ultra-conservative starvation line, and reduced the global hunger numbers by 14 percent in 2012, it did listen to the critique of many activists and academics.
The result was its “Voices of the Hungry project” with Gallup Inc to co-define hunger along with the hungry of the world. This offers lessons for statisticians and survey designers across the world, especially when the surveys are for public good (even if not entirely publicly financed).
Last but not the least, it is essential to pivot data on accountability and to stop using statistical institutions as public relations agencies and survey findings as public relations advertisements by country governments, including in India, where we have seen the Institute of Applied Manpower Research study coming out with its jobs turnaround number on the eve of the 2014 Lok Sabha polls.
As philosopher mathematician Bertrand Russell stated, “There is no nonsense so arrant that it cannot be made the creed of the vast majority by adequate governmental action.” It will be a tragedy if surveys and statistics become such arrant nonsense backed by adequate governmental action. That is also precisely the reason to resist the censorship of essential surveys, each time, every time.