In the recently held elections to the 16th Lok Sabha, the Bharatiya Janata Party-led National Democratic Alliance achieved a significant victory, matched in the annals only about three decades ago. By winning over 330 of the 543 Lok Sabha constituencies – of which the BJP alone got 282 seats – the NDA has formed a government based on a coherent and near homogenous coalition.
This does signify that the ideological and political confusion that one usually sees in coalitional politics has been mitigated in this iteration of the NDA-led government. However, it is also true that coalition politics in India has been a way of decentralisation and participation in power accorded to multiple federal poles, just as it has been a way to keep the largest ruling party in check. This verdict - read in that form – is seen by many as one that does nothing to promise a moderated BJP government, kept in check by more liberal and secular allies, but adds disproportionately high weight to the right side of the political spectrum.
On the other hand, some argue that this one-sided verdict is a healthy one, and the financial markets have welcomed it for providing “stability” in governance. In all this analysis, one important question being raised now is whether the BJP and its allies won an election on their own agenda or if it was simply sharp anti-incumbency against the UPA that helped them win this significant majority.
Why did the UPA lose?
One takeaway from the results is that while the BJP has gained immensely (an increase of 13 percentage points since 2009) and so too has its allies, it is not as if regional parties have seen their vote shares drop as I argue in this article. What is very clear, though, is that the UPA’s vote shares have plummeted since 2009 and it should be a worthwhile exercise to understand the reasons for this dip in fortunes for the coalition, which should explain the opposite - the rise in fortunes of the BJP led alliance.
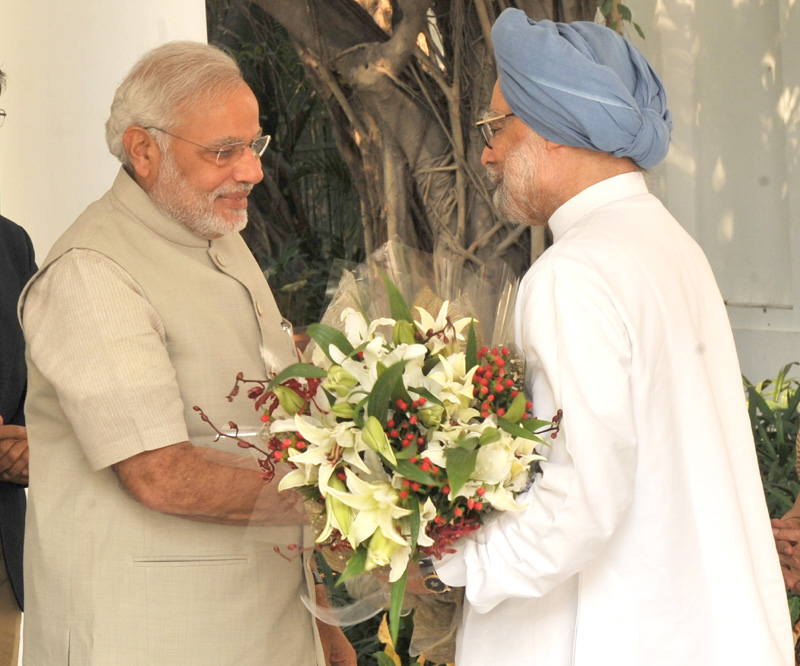
Prime Minister Narendra Modi called upon predecessor Manmohan Singh a day after he took office. Photo: pib.nic.in
How did the Congress and its allies suffer such a huge loss? The easy explanation is that this was due to anti-incumbency after 10 years of rule by the UPA. In the second tenure, little effort was undertaken to curb the mounting price rise of essential commodities, an issue that saw a number of people across sections of the population being alienated from the coalition.
The logjam in decision making on a number of economic initiatives and the series of revelations of scams exposing members of the ministry and the cabinet meant that the UPA lost allies among the powerful corporate lobbies (“India Inc”) even as it lost the battle for public support.
This double whammy, felt by the UPA in the multiple assembly elections (particularly in the latter half of 2013) that led up to the 2014 elections, saw the UPA morale at a depressing low. A vibrant opposition led by the NDA managed to convert the discontent into support for a "decisive" (even authoritarian) leader who promised the moon and some more in development.

With corporate allies shifting their allegiance to the presumptive "prime ministerial candidate," Narendra Modi, the wind behind the NDA sails was large enough to overcome not just the UPA but also the odds arising from the complexities of India's federally decentralised polity.
But can we substantiate the above intuitive assertions using data? In this piece, let us seek to understand the reasons behind the significant drop in the vote shares of the Congress and its allies (the Nationalist Congress Party, the smaller partners of the United Democratic Front in Kerala, the Rashtriya Janata Dal in Bihar among others) in comparison with the 2009 elections.
In order to do that, the following factors may be examined -
a) MP ratings provided by the ADR-Daksh survey: Does a higher rating for the previous MP elected in 2009 correspond to a better chance of winning in this election for the UPA candidate?
b) Assets tabulated by the ADR for each MP candidate: We shall see if a higher asset value for the candidate helps increase vote share (even in a "down election") for the UPA. We consider the asset of the UPA candidate in relation to other candidates in the same constituency.
c) Voter Turnout: Did a higher voter turnout mean a higher negative effect for the UPA? We shall consider here, the true increase/decrease in voter turnout, defined as the "real" increase in the number of voters in each constituency as compared to that in 2009.
d) The Modi effect: It is difficult to quantify the effect of the Narendra Modi campaign which was prominently carried out by the BJP and the rest of the Sangh Parivar. The campaign was given massive coverage by the media (outlasting other campaigns by other parties in terms of airtime provided by the powerful television media ). However, one way to find out the impact of the Modi campaign could be to ascertain whether the UPA won or lost in constituencies in states where a large number of rallies were held by the BJP’s prime ministerial candidate. Data has been provided by the Modi campaign on the number of rallies held in different locations and it is easy to arrive at the number statewise.
e) Effective Number of parties in a particular constituency: As we studied in an earlier article in this series, it does matter if party competition is intense in a particular constituency. Thus it matters if the UPA simply had to fend itself against the NDA (as was the case with Gujarat, Rajasthan, Madhya Pradesh, Maharashtra) or had to compete against other regional parties as well (Tamil Nadu, Uttar Pradesh, Bihar, West Bengal and so on). It is interesting to study if the vote shares of the UPA were affected by the level of party competition in constituencies.
f) The Honeymoon Effect: One reason why political watchers focus on state level equations to discuss national elections is the importance of whether or not parties are in power at the state level and for how long. In recent times, if parties have been in power at the state level for a limited amount of time (since 2013, i.e. 1.5 years ago), they have a better chance of winning elections because of what is called the Honeymoon Effect.
With elections having been held in states and Union Territories like Madhya Pradesh, Rajasthan, Gujarat, Chhattisgarh and the National Capital Territory of Delhi not very long ago, it could be said with some certainty that the party in power in these states had a higher chance of winning in Lok Sabha elections than others.
Crunching the data
The best possible way of determining if each of the above factors were responsible for the UPA’s losses this time around would be to try and formulate a relationship that could determine the extent to which they (combined) had an effect on the UPA’s win or loss.
For those statistically minded, an output of the logistic regression model which does the above for the factors mentioned, is given here (link). The full data used for the study is available here for anyone else to try and replicate the results or to reuse the data.
While the output of the above analysis suggests that these factors do not necessarily explain the reasons for the UPA’s wins or losses in 2014 fully, they do impact it to a substantial extent.
The findings can be interpreted as follows:
a) The MP rating factor is statistically insignificant. This means that trying to find out whether a party won or lost, based on the MP performance/ record in that individual constituency, did not yield any analytical results in these elections. This is perhaps understandable, given that the elections were fought more on the basis of party support or party leaders’ support. MP or MP candidates did not necessarily determine voter choice.
b) Higher turnouts generally resulted in the loss of UPA candidates. This was noticed to an extent in my earlier article, which showed that the highest turnouts were in NDA strongholds. Also as we see in the following table, the constituencies with the highest increase in voter turnouts saw the UPA’s vote share decrease in most cases.
Table 1: Turnout Increase and UPA
| State |
Constituency |
UPA_Vote_Share_Inc (%) |
Turnout_Increase (%) |
| Uttar Pradesh | Bahraich |
-28.6 |
82.22 |
| Haryana | Faridabad |
-24.83 |
80.9 |
| Haryana | Gurgaon |
-26.67 |
74.47 |
| Rajasthan | KARAULI-DHOLPUR |
0.05 |
73.66 |
| Rajasthan | BHARATPUR |
-18.99 |
71.55 |
| Madhya Pradesh | RATLAM |
-8.05 |
69.84 |
| Rajasthan | Kota |
-14.35 |
69.15 |
| Gujarat | Dahod |
-15.71 |
68.48 |
| Rajasthan | Jhunjhunu |
-25.6 |
67.14 |
| Rajasthan | Rajsamand |
-24.41 |
66.82 |
c) The assets of the UPA candidate relative to other candidates did play a role - albeit a minor one. This is consistent with the larger analysis by ADR that higher assets are a signifier of ‘winnability’ of any candidate in the elections. It is clear that parties are increasingly fielding more and more rich candidates than before for this precise reason.
d) The analysis shows that the “Modi effect”, studied only in terms of “number of rallies held”, did not have any significant impact on whether the UPA won or lost. However, having said that, it has to be admitted that the overall Modi effect needs a clearer and more granular definition and explanation than merely the number of rallies held in each state.
e) The more the competition, that is, more the number of parties in the fray, the better the chance that the UPA had. This too sounds intuitive. In places where the UPA was in direct contention against the NDA, the drubbing was significantly higher than in other places where competition was much more broadly-based (such as Punjab, Kerala and Karnataka etc).
f) The Honeymoon effect: Here, one could say that the UPA’s chances of winning came down in most states where there was a honeymoon effect in place. In essence, in states where elections were held recently (from 2013 onwards) and a non-Congress or non-UPA assembly was elected, the UPA had little chance to win the Lok Sabha polls, considering the head start provided to the rival parties which got to power in the states. Considering that most recent elections in states had elected the BJP or its allies in power, this went badly against the UPA.
To sum it up quickly, the UPA’s losses were related to a national anti-incumbency effect. The UPA was done in by a generally negative countrywide opinion of it, but state level political dynamics, the level of party competition and high voter turnout also added to the factors responsible for the UPA’s decline. This decline could not be stemmed despite fielding asset-rich candidates or candidates who had performed well as MPs, since both these factors were either only marginally useful or negligible in determining voter choice.
Note: The author would like to thank Sourindra Ghosh, Amarjyoti Mahanta, Rahul Verma and Amitayu Sengupta for help in interpreting statistical test results and Raghavendra Selvan for help in writing automated scraper scripts.
REFERENCES
1. Preliminary statistics from 16th Lok Sabha Elections
2. Datameet